Building project schedules manually in Excel can be time-consuming — formulas, formatting, custom charts. Smart Gantt was designed to simplify all of that.
This Excel add-in adds a custom ribbon tab that allows you to create functional, elegant Gantt charts in seconds — directly in the spreadsheets you already use.
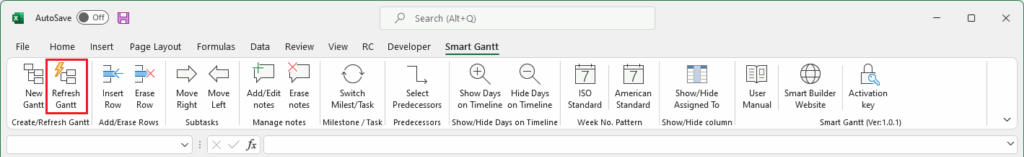
🚀 Everything starts with one click: “New Gantt”
When you click the “New Gantt” button, Smart Gantt automatically checks the current sheet:
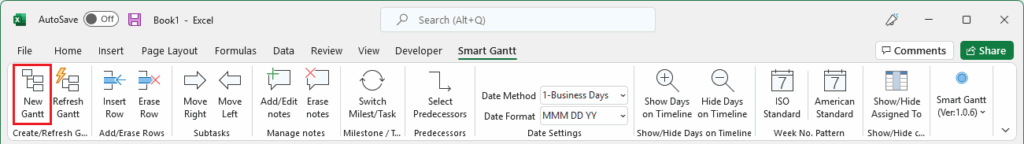
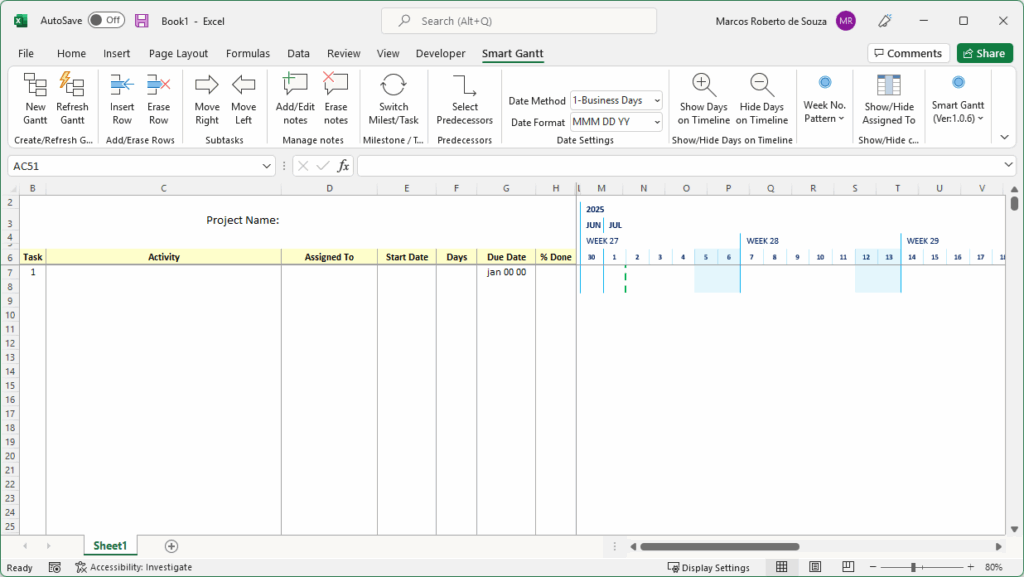
- If the sheet is empty, it’s formatted for immediate use.
- If the sheet contains data, a new worksheet is created and preformatted, ready for project scheduling.
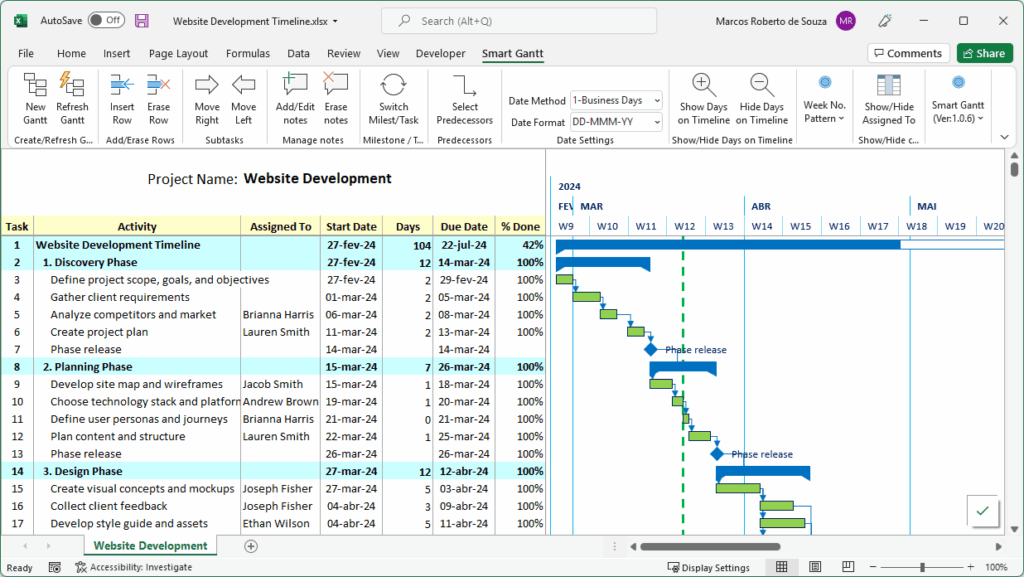
At the top left corner, there’s a dedicated area where you can enter your project name. You can also rename the worksheet tab, which helps when managing multiple Gantt charts in the same workbook.
🧱 A ready-to-use structure
Smart Gantt sets up 7 preformatted columns to help you organize all your project information:
| Column | Description |
|---|---|
| Task | Automatically filled with sequential numbering (1, 2, 3…). |
| Activity | Text field where you enter the task name or description. |
| Assigned To | Text field to indicate who is responsible for the task. |
| Start Date | Date field with an integrated calendar button — click it to select a date using a visual calendar that highlights weekends. |
| Days | Numeric field to define task duration. Minimum value is 0 (represents 1 workday). |
| Due Date | Auto-calculated based on start date and duration. The calculation respects your selected method (calendar days or business days). |
| % Done | Numeric field to indicate task completion percentage (0 to 100). |
📊 The timeline is created automatically

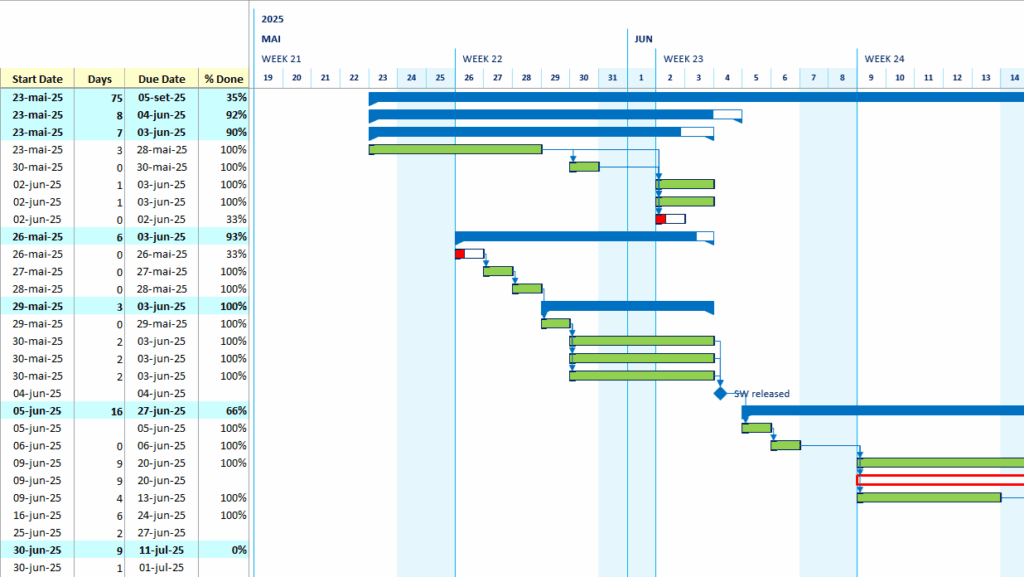
Starting from the % Done column, Smart Gantt builds the project timeline — the visual Gantt chart. Each task is shown as a horizontal bar that:
- Matches the task’s duration
- Fills progressively based on the completion percentage
- Changes color automatically to reflect task status:
| Task Status | Bar Color |
|---|---|
| On time | Blue |
| Delayed but still within final deadline | Orange |
| Delayed and overdue | Red |
| Fully completed (100%) | Green |
A vertical dashed line marks the current date, serving as a reference. If the task’s progress is to the right of this line, it’s on track. If the progress is behind, the task is marked accordingly.
Tip: Every time you open your spreadsheet, it’s important to click “Refresh Gantt” on the ribbon.
This updates all visual elements, including the current date line, task colors, and the timeline range itself — ensuring that the chart reflects the current day and project progress accurately.
🔧 Customize your timeline with ease
Smart Gantt includes intuitive ribbon commands that make it easy to manage and adapt your schedule:
- ➕ Insert Row / Erase Row – Quickly add or remove tasks
- ➡️ Move Right / ⬅️ Move Left – Turn tasks into subtasks
- 🔗 Select Predecessors – Define task dependencies
- 🔄 Switch Milestone / Task – Convert a task into a milestone with one click
- 📅 Date Method – Choose between calendar days or business days
- 🗓️ Date Format – Set the date format (e.g., MM/DD/YY)
- 🔍 Show / Hide Days on Timeline – Switch between detailed daily view or weekly overview
- 👤 Show / Hide “Assigned to” – Hide the assigned person column to maximize timeline space
🎯 Why choose Smart Gantt?
- Everything happens in Excel — no need for external tools
- The schedule is created automatically with a professional layout
- You save hours of work formatting charts manually
- The result is clean, functional, and ready to share
- It’s affordable — far cheaper than full project management suites
🔗 Get started now
If you’re already using Excel to manage your project data, Smart Gantt is the next logical step. One click turns your worksheet into a real, dynamic project timeline.